Figure (A) shows our genome-wide eQTL localization map for a given period; Figure (B) is a bar graph of GO enrichment for all genes within a given Bin; Figure (C) is a box line plot of the expression of a given probe based on Bin classification of genotypes; Figure (D) is an association fold plot of all probes associated with a given Bin; and Figure (E) is a fold association plot of all eQTL associated with a given probe. (E) is a line association plot for all eQTL associated with a given probe, and independent and significant loci are marked in red. Points in (A) can be clicked to jump to (E), and points in (E) and (D) can be clicked to jump to each other.
In the figure labeled (a) select the way in which the query is to be performed, in (b) select the specific growth period, in (c) select the type of results to be displayed, and in (d) we will allow the user to enter the appropriate keywords, and the results of the query will be displayed in the form of a table and a graph.
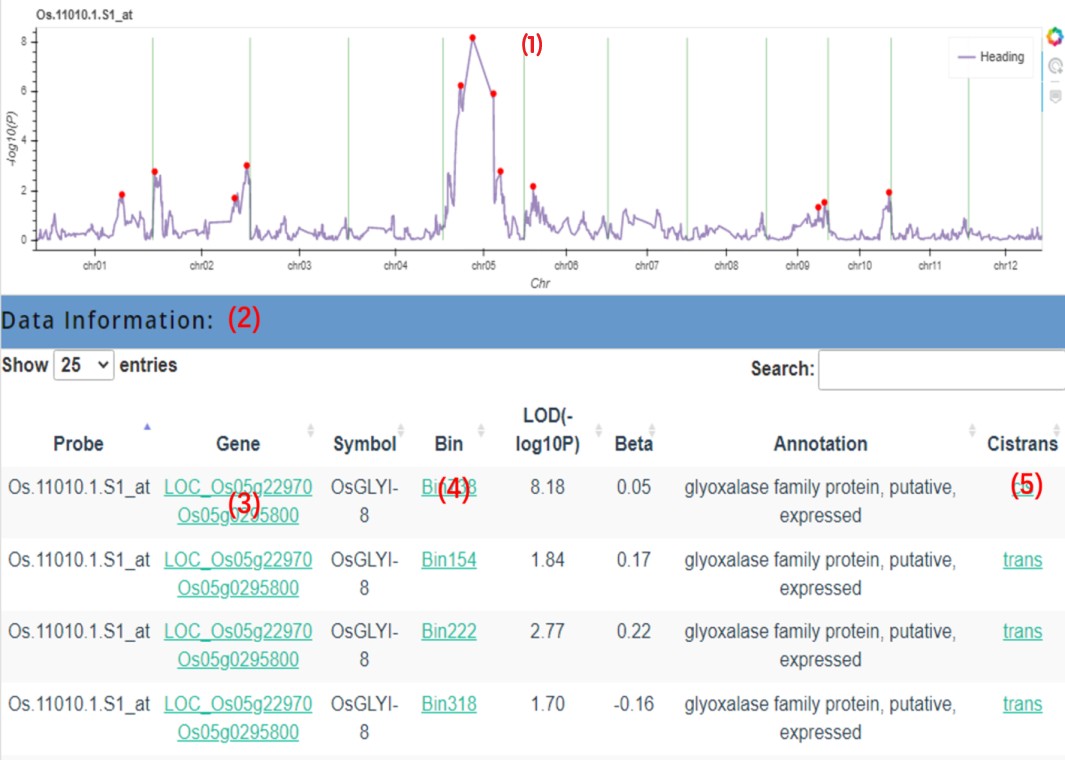
The query result will return a line graph of eQTL (1) and the corresponding information table of significant eQTL (2), we can click the corresponding point in (1) to jump to the corresponding Bin information; in the table we also set the corresponding jump link (3) for the gene name (including the gene name of MSU and the gene name of RAP), which is convenient for users to obtain the complete gene information more quickly; we We can also click on the corresponding Bin name in the table (4) to jump to the query result of the corresponding Bin, and at the same time, users can click on (5) to obtain the expression amount and genotype information of Bin in each individual of the probe set of the corresponding tissue.
In the GO enrichment module, each Bin significantly associated gene is filtered out and GO enrichment is performed using topGO. We present the GO enriched background gene set on this page for easy viewing and downloading by researchers.
The results of GO enrichment for all genes within each Bin are plotted in (A). Hovering over (B) will provide detailed information on P values, GO names, corresponding GO annotations, etc. and we present all the results of the enrichment in a table in (C).
Enter the corresponding probe at (A) and the corresponding Bin at (B) to obtain a box plot of the expression of different genotypes at that Bin.
The graphs (A) and (B) show the expression box plots of the samples with different genotypes of this Bin, and the graph (C) shows the genotype and expression value of each sample under this Bin.